Working for the USDA, part 2: changing the language of statistics and science
Published:
To make science better, we need to change the way we interpret and analyze data, moving away from black-and-white yes-or-no answers and towards describing the full range of what we believe to be true.
Earlier this month I wrote a post about starting to work for the Ag Research Service, part of the US Department of Agriculture. In that post, I talked about trying to use agricultural research to promote sustainability and climate resilience of the food system. This time, I’m going to talk about my other long-term goal at USDA: changing the way we analyze data and talk about evidence. That might seem a little technical or even trivial, but I think it has the potential to change the way scientists think about reality and to create a more honest and collaborative scientific enterprise.
My goal is to get USDA scientists to move away from the old paradigm of yes-or-no answers to statistical questions. For historically obscure reasons, the number 95% was enshrined as the gold standard for whether a phenomenon you observe is “real” or not. In other words, if we are 95% (or more) confident that, let’s say, a drug reduces cancer rate in lab rats, or a new crop rotation technique increases corn yield, or whatever, we can say “drug x causes significant reduction in cancer” or “new crop rotation significantly increases corn yield,” but if we are only 94% confident based on our data, we can’t say that. You might have heard the term “p-value” or “p < 0.05.” The 0.05 is derived from the goal of achieving 95% confidence (1 - 0.95 = 0.05). The p-value is a number that you can calculate using a set of data, which tells you the probability that you could have observed that set of data if your hypothesis wasn’t true. For example if you think a drug reduces the chance of getting cancer, and you see that 30% of rats that got a placebo get cancer, but only 20% of rats that got the drug get cancer, one of two things could be true. Either the drug really does reduce the chance of getting cancer (your hypothesis), or the drug does nothing and the difference you observed in cancer rate was just a lucky result (the so-called null hypothesis). If the null hypothesis were true, in your one particular study, the cards just happened to fall in your favor, but if you did it again they might well not. The p-value helps estimate the chance that you could have gotten at least the difference between drug and placebo you did, or better, if the drug actually were useless. The lower the p-value, the more confident we can be that our results were not a one-time fluke caused by chance, making us more confident that the null hypothesis isn’t true.
Sounds good so far, right? Well, in contrast to some people, I have nothing against p-values, they are a very useful tool. The problem arises with the artificial threshold of p < 0.05. The current practice across much of science is to say a result is “significant,” meaning we have significant confidence to say the null hypothesis isn’t true, if p < 0.05. If it is any higher than that, even 0.051, we can’t. This is an illogical and absurd way of doing science. There’s no such thing, in reality, as a black-and-white distinction between “yes it has an effect” and “no it doesn’t.” And even if there were, why should it be 0.05 for every possible phenomenon in the world, from cancer drugs to climate change to social relationships of chimpanzees?
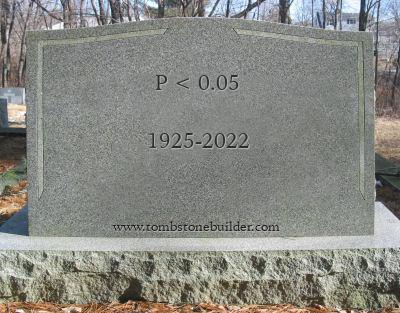
The problem isn’t just that the 0.05 (or 95%) cutoff is arbitrary. Because publishing your scientific study is more likely when you have a “significant” result (“significant” is the official word for 95% or greater confidence), scientists are incentivized to fiddle around with their statistical analyses until they get something 95% or greater, then only publish those results. This leads to a lot of spurious results getting published. There are many ways to analyze a single dataset. You can often get p < 0.05 by trying out a bunch of ways until you reach that magic number, a practice known as p-hacking. Worse, the incentive to only publish significant results leads to people effectively discarding lots of interesting data that can’t be forced to produce 95% confidence so that no one can use and learn from it. This has led to a situation called the “reproducibility crisis.” Because many published scientific results bear the fingerprints of p-hacking and the bias toward publishing significant results only, they do not accurately reflect how confident we are that a phenomenon is real. So if someone else does another study to try to reproduce the same phenomenon in a different context, they often can’t. Using the term crisis is no exaggeration — if a scientific result can’t be repeated, it can’t be applied to a new purpose or used to benefit humanity in any way.
So much for the problem. What about solutions? There are a couple of things I’m trying to do. First, the concept of p-values comes from a kind of statistics called “frequentist.” The alternative is called “Bayesian.” With all due respect to Reverend Thomas Bayes, “Bayesian” isn’t the best name for it because it doesn’t tell you anything about what Bayesian inference is. In my opinion, Bayesian inference has two big advantages over frequentist. First, Bayesian analysis has a built-in way to include your prior knowledge in the analysis. Instead of always being forced to go with a null hypothesis that “X is not true at all,” we can input into the model our prior beliefs about what possibilities are the most plausible. Second, it naturally describes our uncertainty about phenomena and the strength of evidence for and against them in a more continuous way. Instead of talking in black-and-white, yes-or-no terms (is there an effect or isn’t there?), we can give more honest descriptions of the size of the effect and what we think plausible upper and lower limits are for that size. I think that’s asking the right question because everything in the universe has some effect on everything else, so the best we can do is say, based on our knowledge and the data, what is the range of outcomes most likely to be true.
I am not an unquestioning disciple of Bayesian statistics who refuses to use any other method, but I’m trying to move the needle a little bit. Many scientists are unaware of how to do Bayesian statistics because in the past, it was really hard to actually put it into practice. So they’re a little scared of it to be honest. Nowadays, thanks to a few hard-working people that I am incredibly indebted to12, there are freely available and easily implemented ways to do Bayesian stats. So I’m introducing it little by little to USDA scientists and encouraging them to do Bayesian stats, or at least to use more honest and continuous language about evidence in their papers. But there is some resistance mainly because people are worried their papers won’t get published unless they use the word “significant.” But I think acceptance of the less artificially black-and-white language about uncertainty and evidence is growing. Scientists are moving away from the old yes-or-no paradigm and being more honest — at least I think so on optimistic days!
All of this is also tied into another issue, which is the openness and availability of data and methods. It’s easier to engage in p-hacking and be obscure about how you got to your conclusions if people cannot access the data and computer code that you used, and try it out for themselves to see how you achieved your results. So another thing I’m trying to do at USDA is to make sure all the studies I’m part of have data and code that are out there somewhere on a server that people can freely download. That’s a critical piece of the puzzle. I could write a whole bunch more about that, and I probably will because this blog post is already probably too long and didactic.
If you’ve read this far in the post, thanks! I want to just quickly set the record straight that I am by no means the only person in the Ag Research Service working to change the narratives about statistical evidence and increase the openness and reproducibility of science, nor am I immune from any of the bad practices I discussed above. I am guilty of p-hacking and searching for significant results too. But it’s important to recognize that this is a journey — ideally, with every project you do, you learn a little bit more and get a little bit better at doing it right. Also, Bayesian stats are not a panacea. On their own they don’t prevent people from manipulating stats and data to get a good-looking but untrue result. But I think it is a really important step in the direction that science needs to go.
Stan software, originally created by Andrew Gelman and maintained by a team of dedicated folks, is a great tool. ↩
The brms R software package created by Paul Bürkner is another incredibly useful tool that I use every day. ↩
Leave a Comment