Quentin is committed to making data science open and reproducible and breaking down barriers that keep social and environmental researchers from using big publicly-available data. In practice, that means designing and teaching lessons on data science and statistics, and creating and contributing to software packages for high-performance computing, data visualization, and ecological data analysis.
Teaching Stats and Data Science
Since 2021, Quentin has been teaching stats and data science to scientists at USDA. The lesson materials can be found at the SEA Stats training page. Topics include basic R, linear models, Bayesian regression, R for SAS users, and data visualization with ggplot2.
From 2019-2021, Quentin created online data science lessons and taught them in-person and virtually as part of the data science team at SESYNC. Quentin has either created or contributed to many of the lessons on the SESYNC cyberhelp page. Lessons that Quentin contributed to include basic and advanced git, using R and APIs to get online data, and geospatial data packages in R.
R Packages
These are the R packages that Quentin has created or contributed to.
![]()
rslurm
Researchers working with big socio-environmental data are often familiar with synthesizing and analyzing data in R, but they run up on memory and processing time limitations. Many of their institutions provide high-performance computing clusters for running big computing jobs. But using those clusters requires knowledge of shell scripting, which many socio-environmental researchers don’t have. The rslurm package, originally created by Philippe Marchand, a SESYNC data scientist, solves this problem. It allows users to run computing jobs on a Slurm cluster directly from R! The package creates all the necessary shell scripts for you behind the scenes, and manages the jobs automatically. Quentin maintained and contributed new features to the package from 2019-2023.
ggalluvial
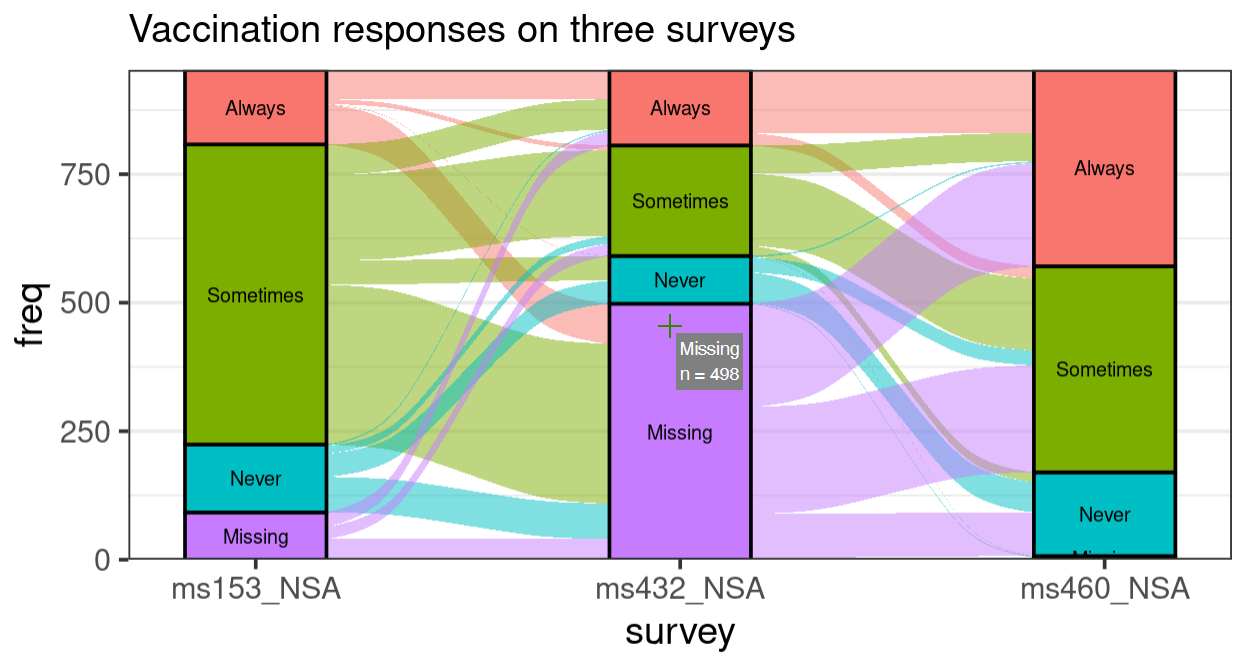
Quentin’s contribution to the ggalluvial package started when a research team asked him to work on an interactive visualization of their data. While he was making the Shiny app, he talked to the developer of ggalluvial and wrote some code to make alluvial plots that the user can interact with. He wrote a vignette for the package so that other people could benefit from what he learned — open data science at its finest! See a demo app here.

Ostats
The Ostats package was born out of a collaboration between Quentin and fellow postdoc John Grady back at Michigan State (see the Research page). It allows users to calculate “O-statistics,” community-level pairwise niche overlap statistics, and to make plots to visualize community trait overlap patterns. Quentin is the lead developer of Ostats and co-mentored two undergraduates who helped write the code.